Earlier this year we launched our Asana reporting dashboard for you. It allows you to analyze your team’s data in Asana and generate a nice visual one-page weekly report dashboard. You see open and closed task statistics and actual tasks for each person or project, completion ratios, overdue item counts and percentages, comparison to last week and much more. You get it via e-mail, in PDF and as an interactive web version.
The new improved 2.0 version of it is now live. We asked all of you what could be improved. We listened and talked to many of you. Then did a lot of design and development. Voilà – check out the new Asana reports. They are sweet.
Here’s what’s new:
- Configure report weekday and time
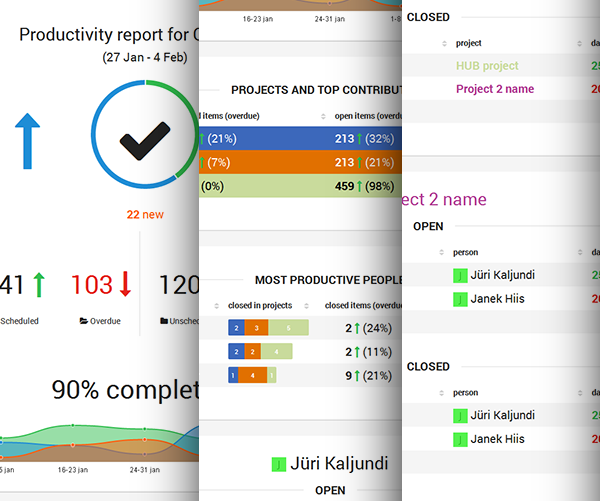
- See task items under each person
- See task items under each project
- Exclude or include people or projects to show
- One-click column sorting of items by text, due or closing date, project or person
- Beautiful HTML e-mail report in addition to PDF
- Improved interface design
- Monthly report option in addition to weekly
- Custom report period on the web
- … and much more!
There’s no better way than to just try it out. It takes just one click to log in via your Asana Connect credentials. Then head to Settings page to customize the report to your liking. The rest is automated – sit back and start getting your weekly or monthly reports.
The major change in 2.0 is the possibility to see actual open and closed tasks either for each person or each project. You can now really see what got done last week and what’s planned for the next. The settings allow you to enable this just for people, projects, or both, and choose if you’d like to see just closed or both open and closed items.

Weekdone Asana reporting was initially developed for team leaders and managers to understand their team’s productivity and actions. Now with the possibility to include or exclude projects or people you can use it also as a single person to assess your own productivity (include just yourself) or for one project as a weekly Asana project report. There’s a lot you can learn about yourself – we believe there is a lot to be improved in quantifying your work. The thing is to find a good mix between quality and quantity measurements, as both are just as important.
We love Asana here at Weekdone and believe it’s one of the best ways to manage your team tasks and productivity. But sometimes you need to take a step back and look at the big picture. Weekdone Asana reporting dashboard is the best way to see at a quick glance who did what and what’s coming next. As a team leader or member you can save hours per month from sifting through Asana or having the dreaded status update meetings. The Asana dashboard can replace all that. Give it a go – you’ll love it.
We are not stopping here. Let us know in comments or at asana@weekdone.com, what would you like to see added or improved next. What would be in your dream Asana report, dashboard or analysis tool? Together we’ll build the world’s best Asana reporting solution.