Are you using the much loved Atlassian JIRA issue and project tracking tool? Need better reporting?
Would you like to know visually at a quick glance, what your people, teams and projects are up to? Now you can.
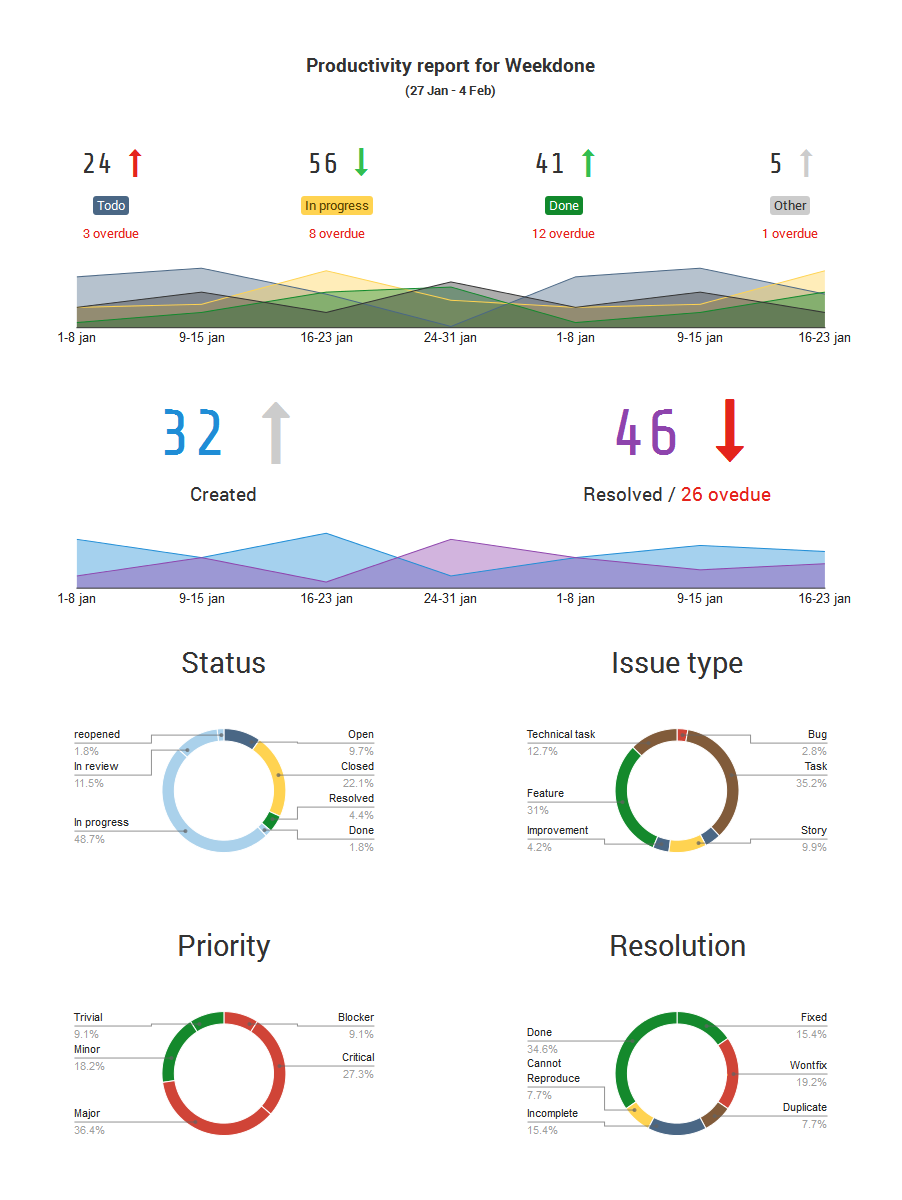
Introducing the Weekdone JIRA Reporting and Dashboard service. It’s the best solution for Atlassian JIRA reporting, to generate beautiful visual one-click reports and dashboards out of JIRA. You get the report as an interactive web version, via e-mail or as a PDF.
You’ll see in a graphical form:
- open and closed task statistics
- category item counts
- completion ratios
- overdue item counts and percentages
- comparison to last week or any period
- and much more.
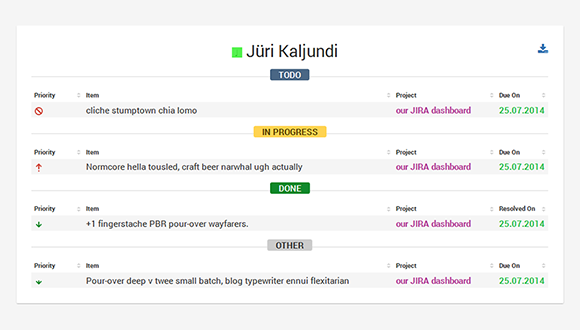
An example of the dashboard summary is above (click it to zoom in). Below the summary, for each project, person or tag you see the actual issues sections grouped by the 3 JIRA categories, as explained below.
Installing the add-on
Just add the add-on on Atlassian Marketplace and start using it under the Weekdone header tab in your JIRA. Voilà! The report will be right in front of you. A PDF gets e-mailed to you as well. Unlike in other reporting products, there is no complicated tuning or configuration to get started – you can do that later. The defaults should work like magic for most of you. In minutes you’ll get a pretty visual dashboard report for your team’s weekly, monthly or daily Atlassian JIRA performance.
Another way to install is to find it under the Discover new applications tab under your company’s JIRA Settings.
Use it as a wallboard
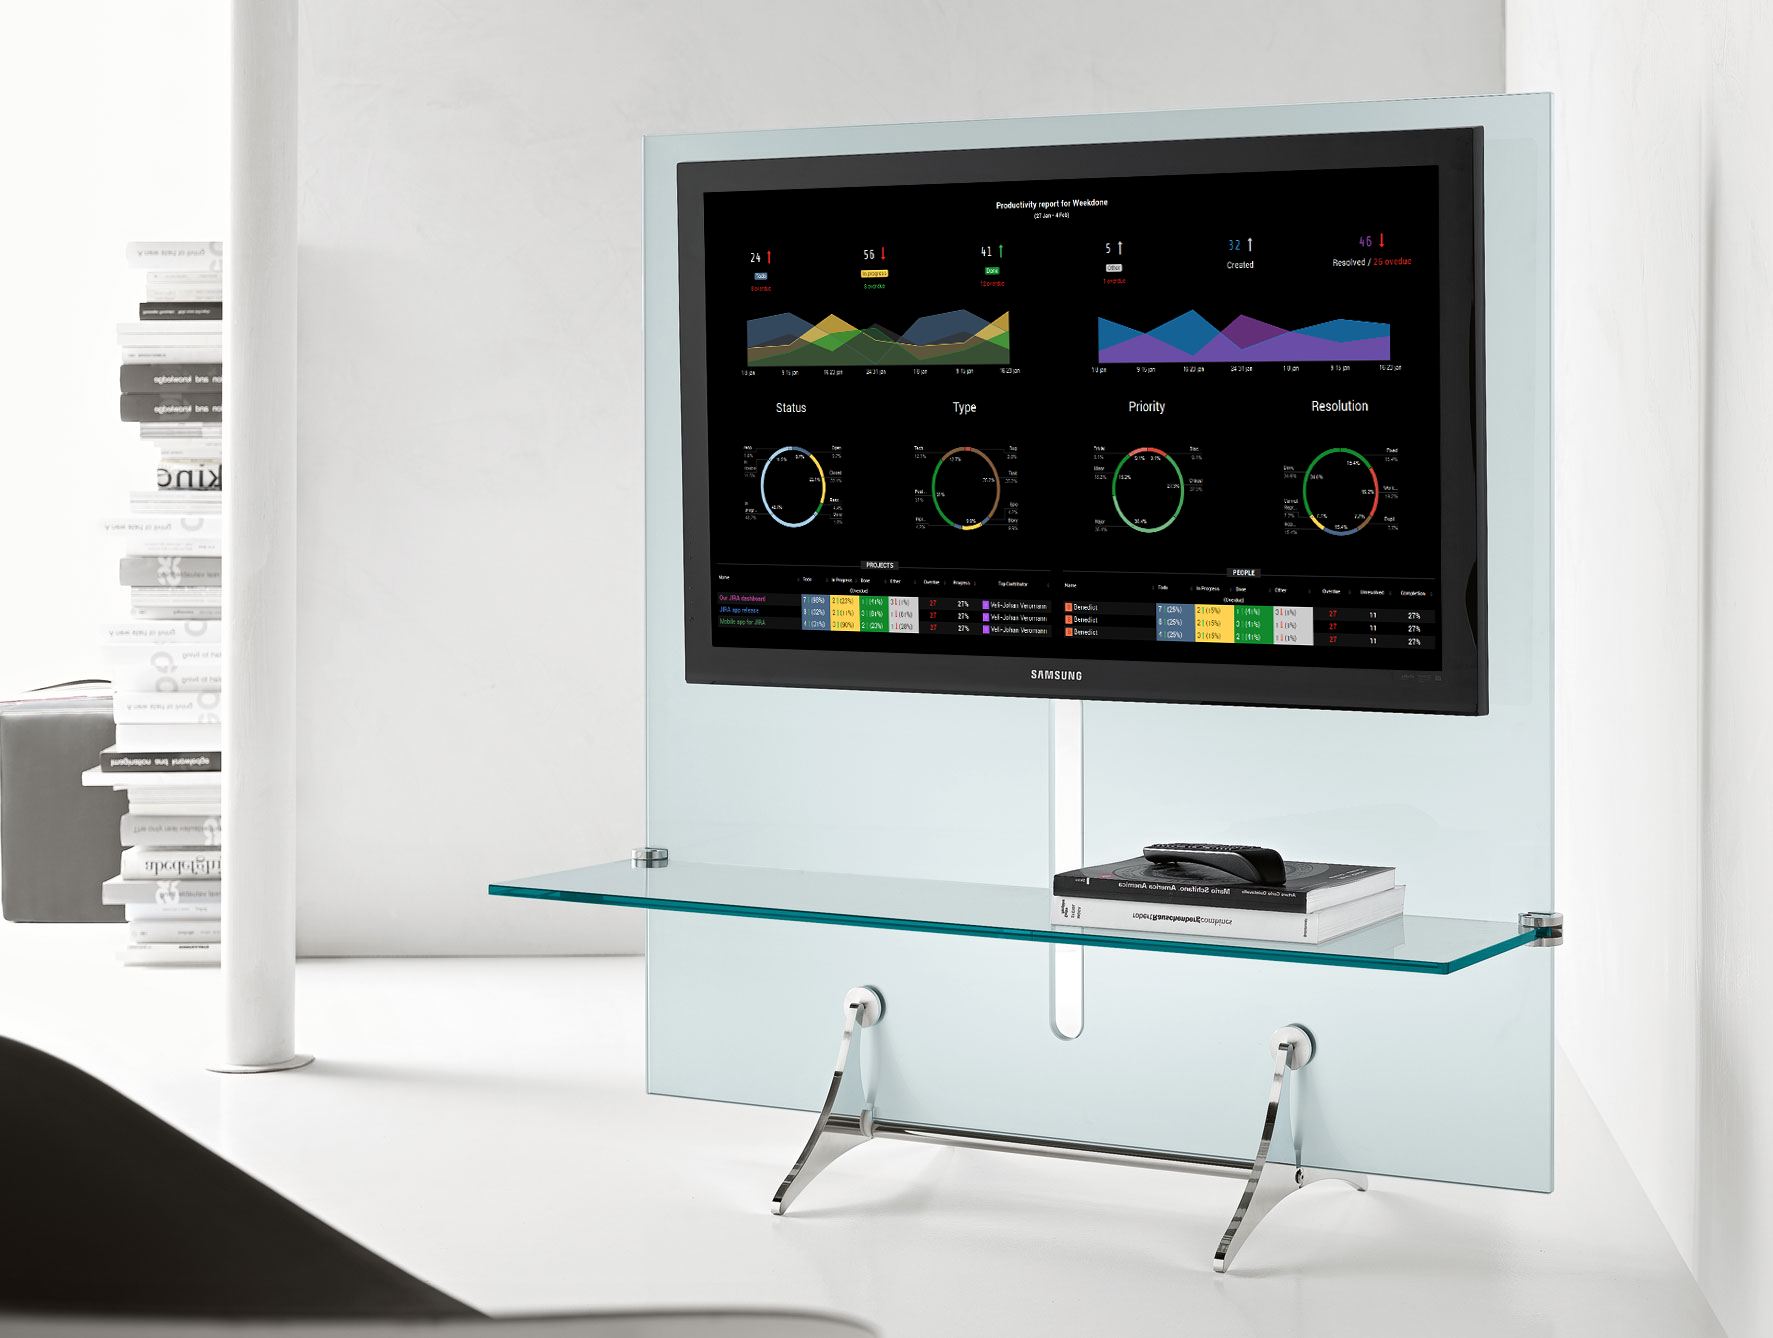
Weekdone Atlassian JIRA dashboard is also available as an information radiator wallboard. Project it on a screen in the office to always see your key metrics and share them with the team.
People dashboard
Besides all tasks, our JIRA people section shows for each user:
- number of items they have closed in each category
- total closed and open items
- trends compared to last week
- percentage of overdue tasks
- completion percentage
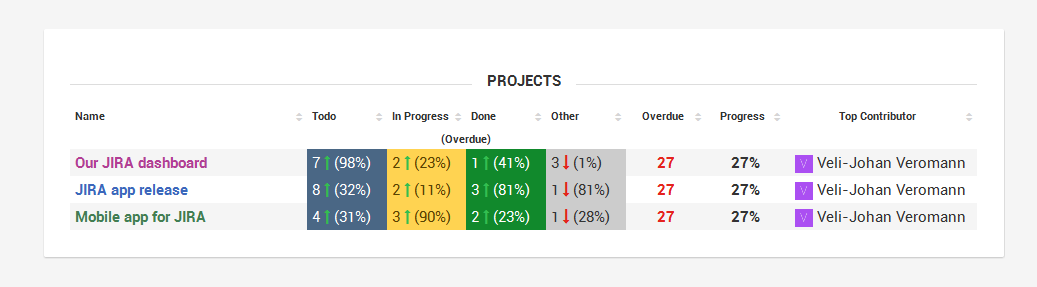
Projects dashboard
The projects section shows for each project:
- project progress percentage
- number of closed and open items in each category
- trends compared to last period
- percentage of overdue tasks
- the person who has closed the most items in each project
There’s also a tags report with similar data. You can enable it under your Settings. You’ll find plenty of other configuration options there.
We love beautiful design
At Weekdone, being design-driven, we have some goals for the services we build. They must be easy to use and understand, bring instant utility, do one thing really well and look great visually. That’s what we are building for JIRA reporting as well. We want this to be the best JIRA analytics and reporting service out there. One that everyone using Atlassian products will use for their reports. Try it now.
Keep in mind that today this is just the first beta version. While fully usable for production, there might be some small glitches or missing parts. Sorry if there are, just let us know.
What you’ll get
By default, our Atlassian JIRA reporting dashboard follows the weekly paradigm – like appropriate for Weekdone. The report is for the last 7 days, ending today midnight GMT.
All comparisions – red arrows down and green up – are comparisons to the previous period you’ve selected.
Completion is calculated as comparison between how many open items you used to have and how many there are now. Let’s say you had 10 open tasks, closed 5: that’s 50% completion.
There’s no better way than to just try it out. It takes just one click to install it and try it out. The rest is automated – sit back and start getting your weekly or monthly reports. Later head to Settings page to customize the report to your liking.
Weekdone Atlassian JIRA reporting was initially developed for team leaders and managers to understand their team’s productivity and actions. Now with the possibility to include or exclude projects or people you can use it also as a single person to assess your own productivity (include just yourself) or for one project as a weekly JIRA project report. There’s a lot you can learn about yourself – we believe there is a lot to be improved in quantifying your work. The thing is to find a good mix between quality and quantity measurements, as both are just as important.
Pro tip: Try using the Weekdone JIRA report for your next stand-up meeting. You could save a lot of time and make the meeting much more quicker and structure. Who would not love that?
You tell us: What would you like to see implemented next in our Atlassian JIRA dashboard?
Install it now and enjoy. Any thoughts? You can e-mail us at jira@weekdone.com.