(Skip reading and get the code from GitHub.)
Like a lot of developers, we at Weekdone make use of the Google Chart libraries to generate visuals of our data.

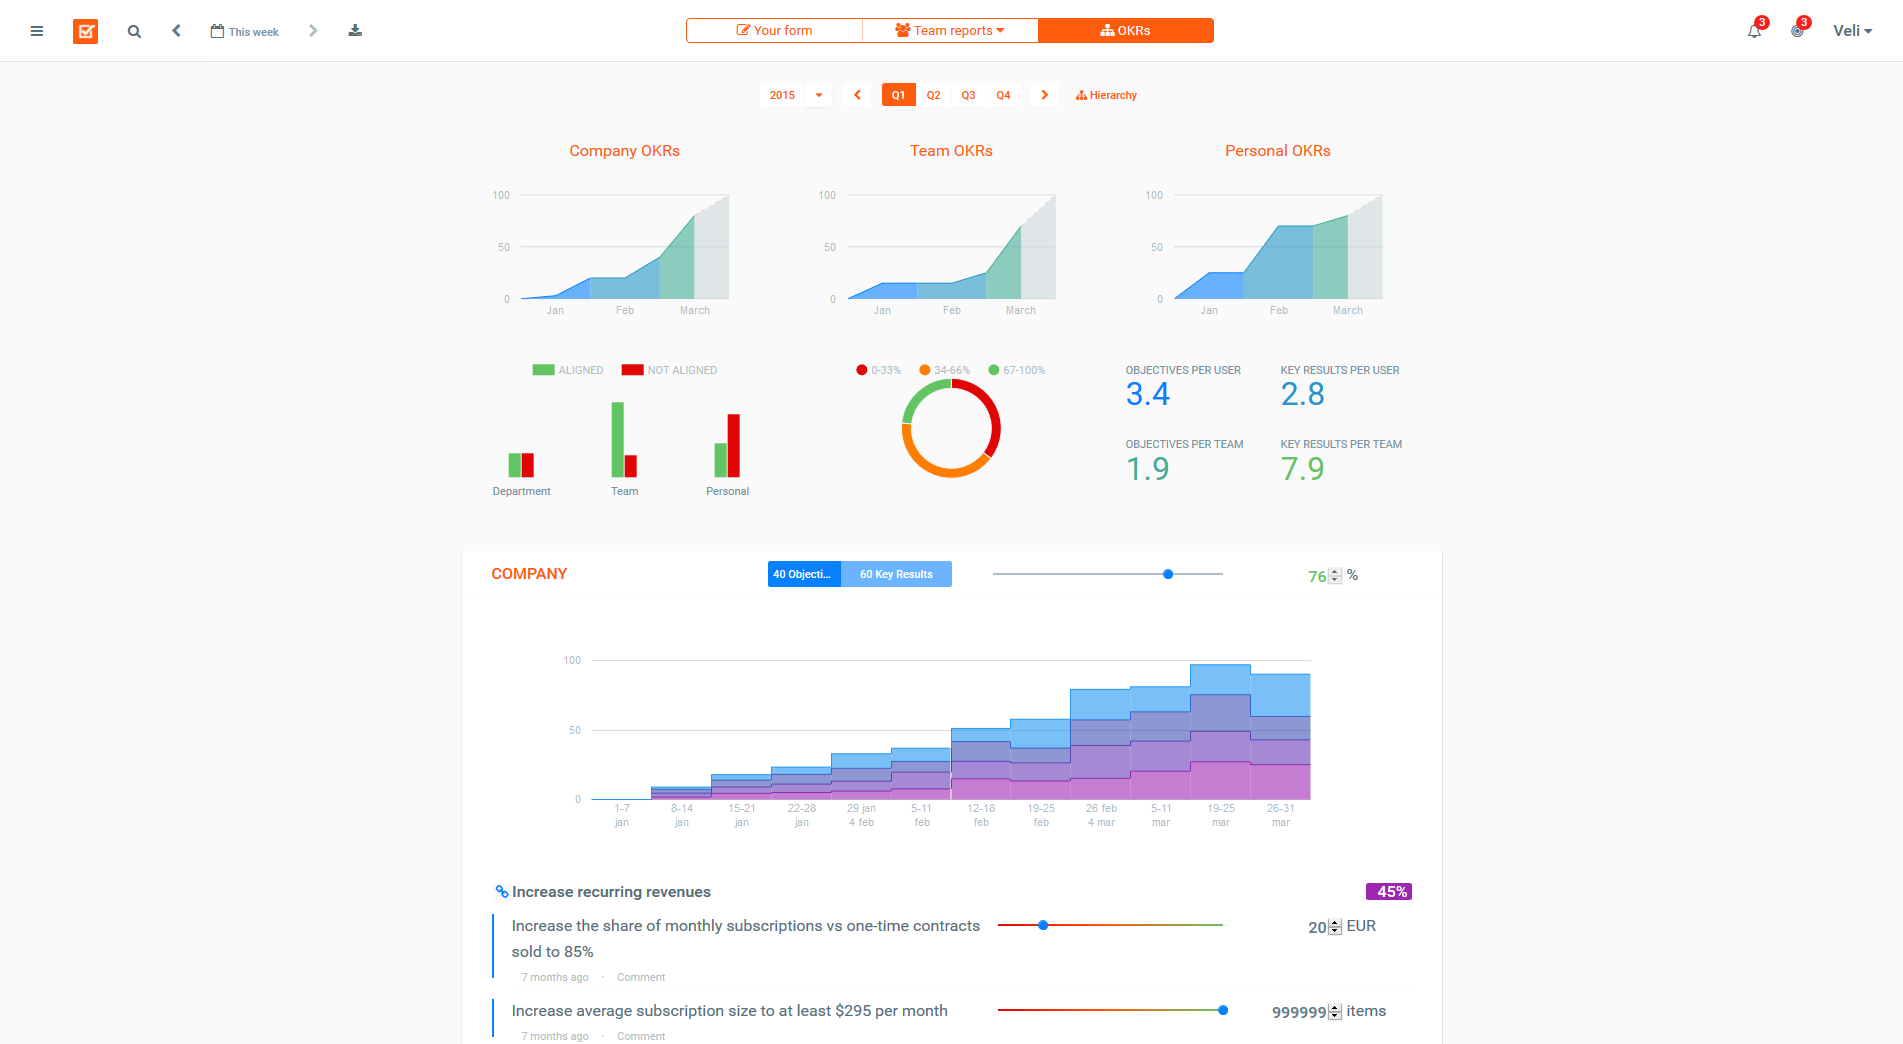
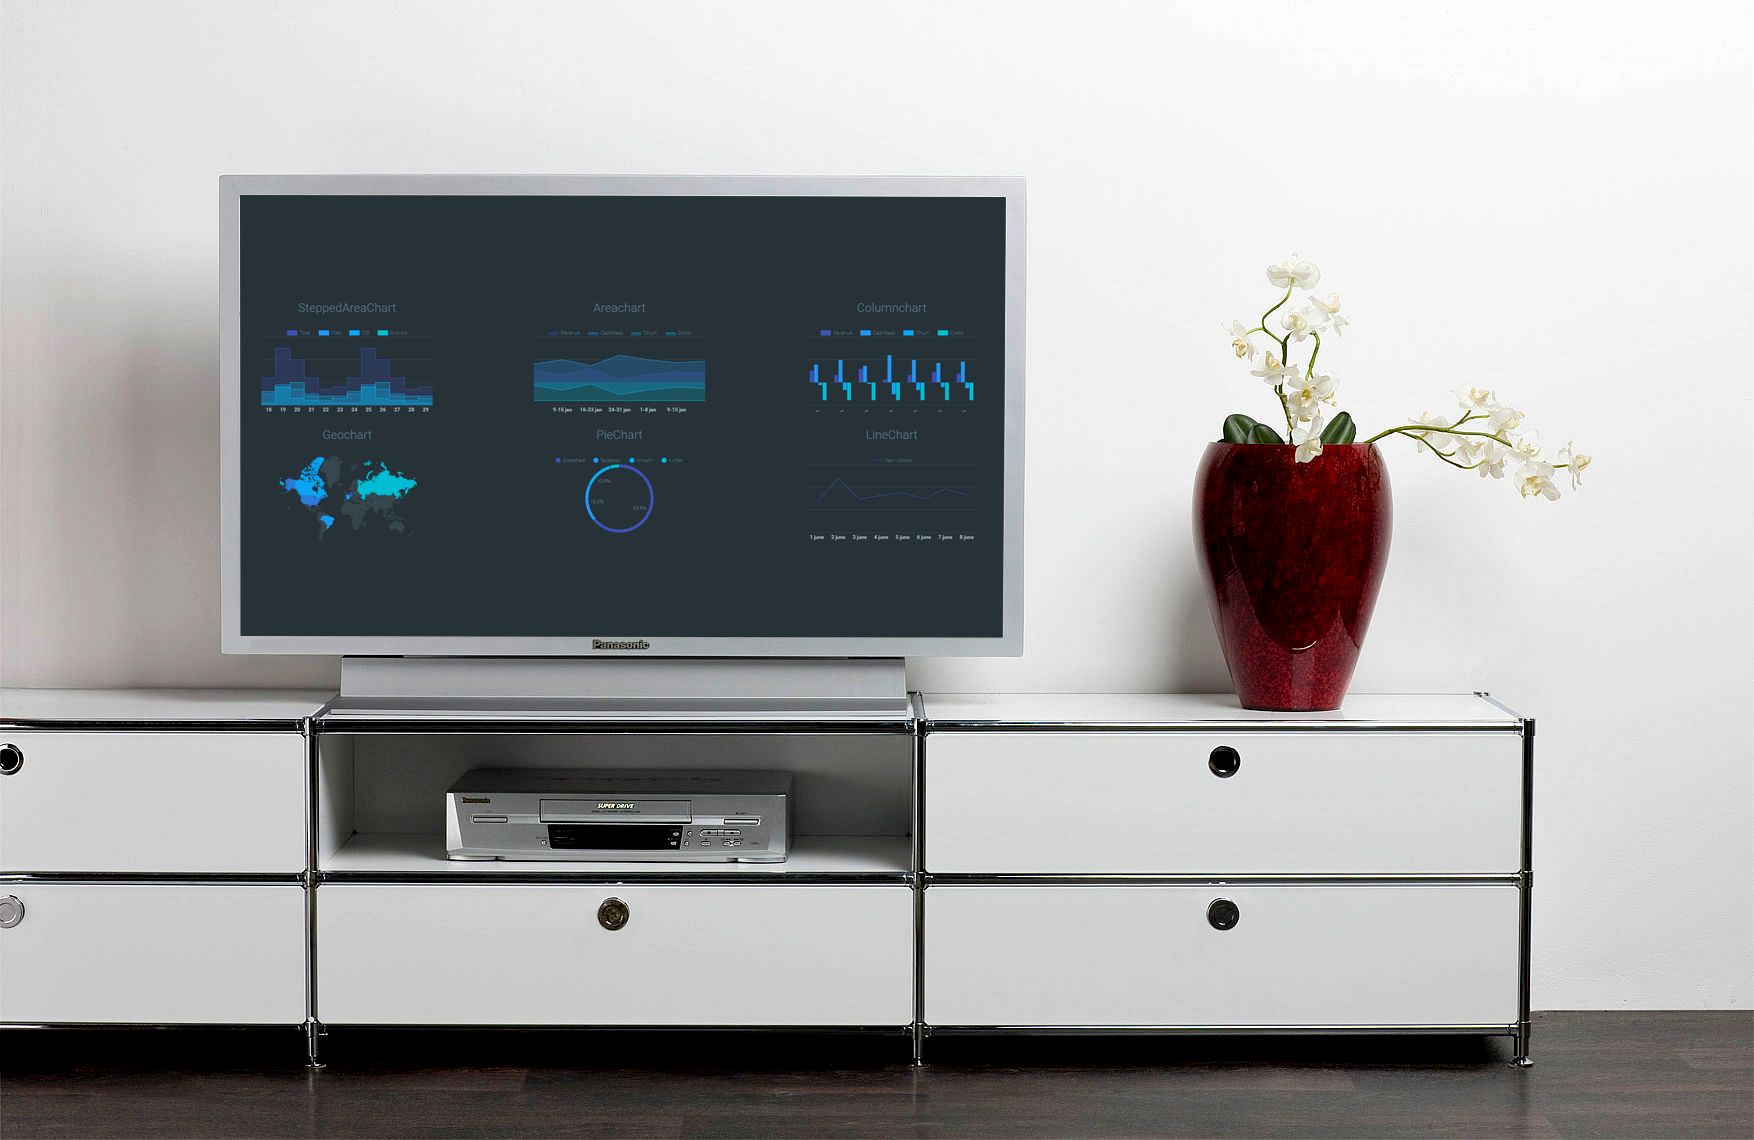
We use them both in our product (OKR dashboards, Weekly report dashboards), and internally to keep an eye on our KPI metrics on a wall-mounted TV.

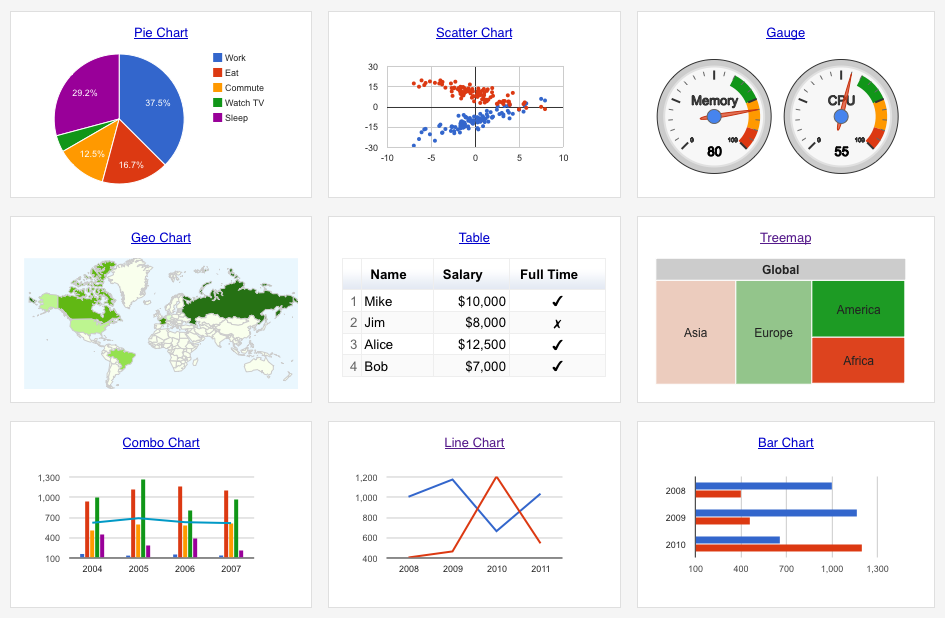
The chart library makes visualising data a breeze, but unfortunately the default styles do not look very modern.

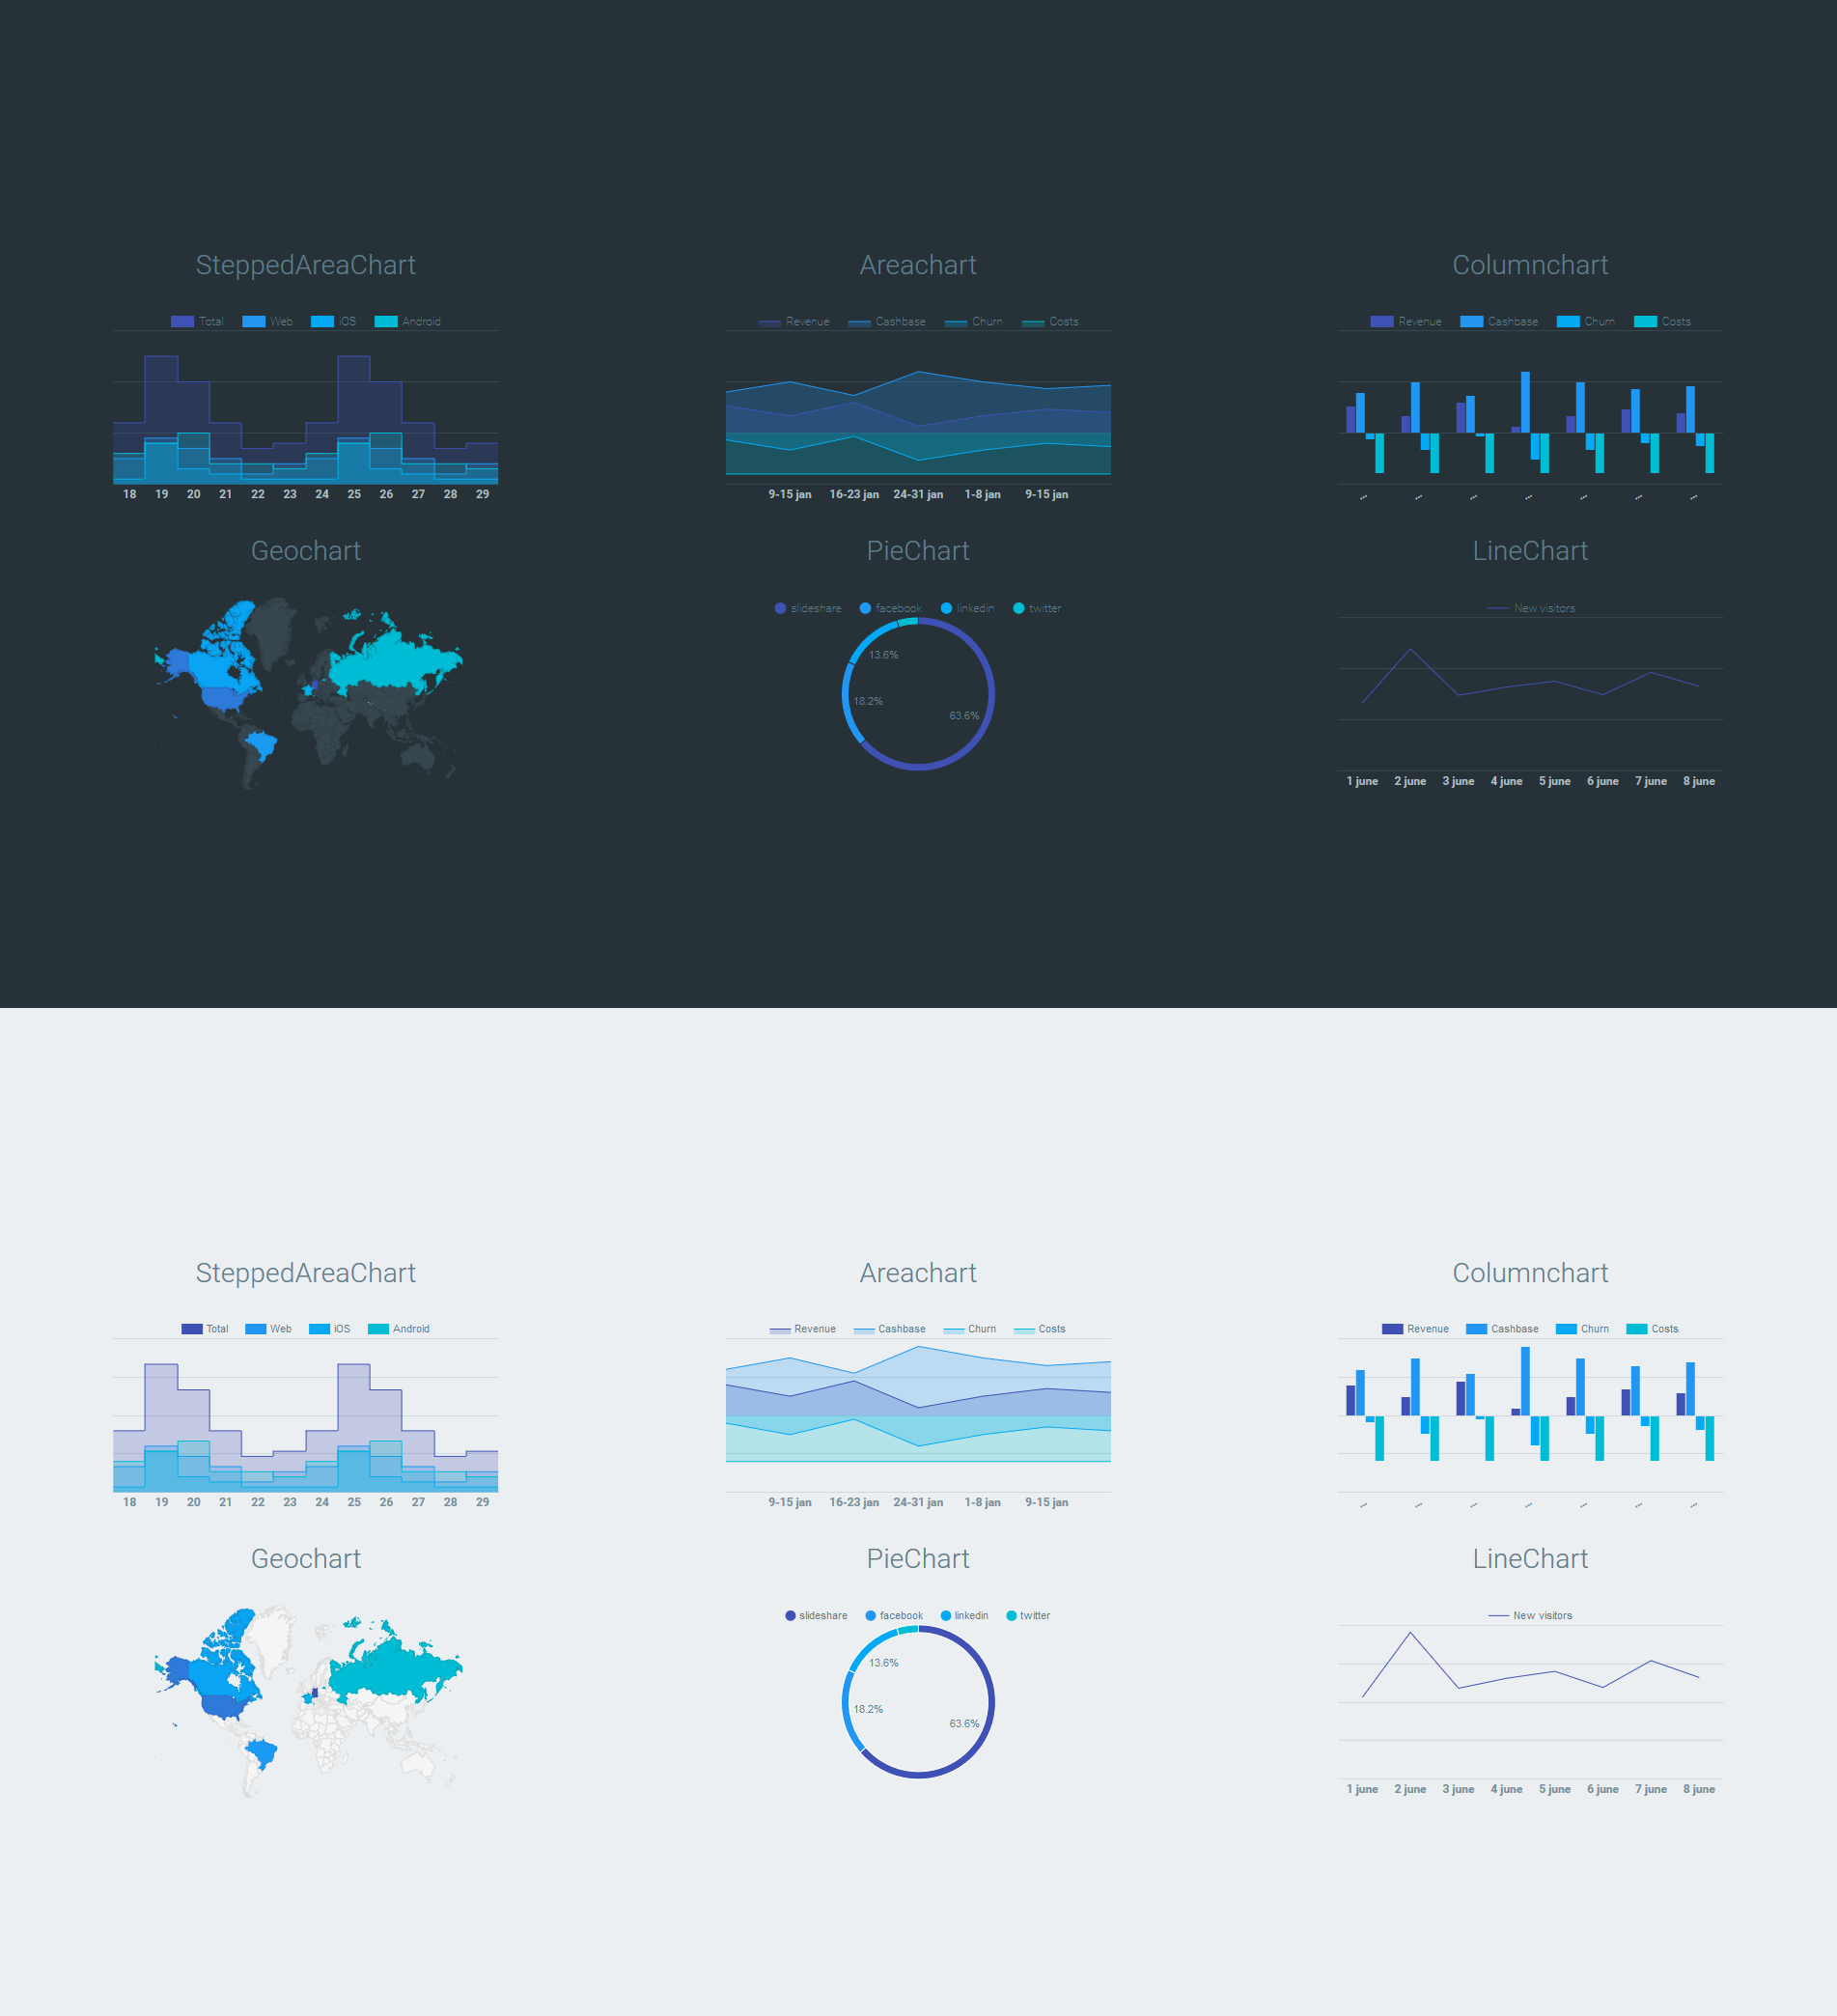
This is why we decided to create and release a plug-and-play set of chart styles, based on Google Material Design. The styles can be copied to your existing projects, replacing the default options values. The code features examples for both light and dark preferences.
