OKRs – Objectives and Key Results – are all about visualizing your progress towards set, quarterly goals. At Weekdone we believe you should revisit your OKRs at least weekly: marking your key results progress, checking in via comments, and reflecting on your progress.
The key to good OKRs is to always know how you, your team, and your company are doing. It’s not about setting them once and then coming back in 3 months time. OKRs must drive your actions every day, every week. It’s a tool for personal and team guidance and feedback.
To make that happen, automated visual OKR dashboards, that show at a glance your progress and next steps, are a must.
Improved OKR Dashboards in Weekdone
Today we’re happy to launch the new and improved version of our automated smart OKR dashboards. Our goals in developing these were to:
- Indicate how far you should be with your OKR progress at any point in the quarter.
- Visualize your current total and per-objective progress versus expectations.
- Praise you in case you hit or exceed your goals.
- Give you a nudge in case you’re falling behind your expected targets.
We’re big believers in smart automation and this is a step in that direction in Weekdone.
Expectations versus reality
Here’s how it works. We’ve introduced something called expectations. These show how far you should be with your OKR’s completion at any point during the quarter. Mid-way through the quarter you should be at 45% completion, by end of second month at 66% and so on. Just divide the total percent completion to be hit by the end of the quarter by number of weeks.
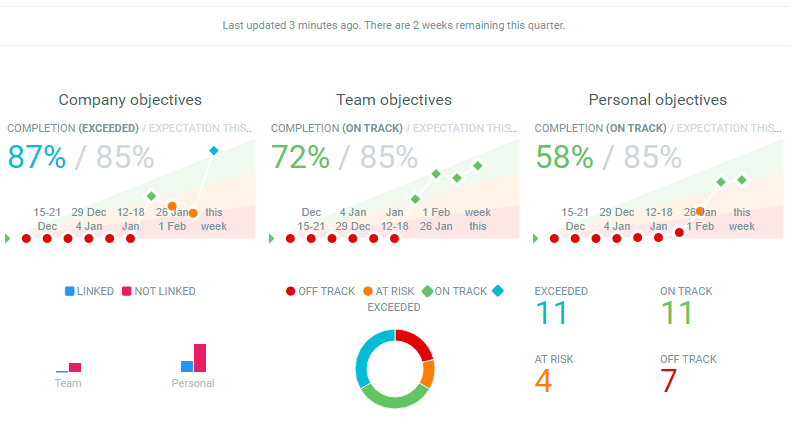
When you look at the OKRs section in Weekdone, we now first show you when you lasted updated your OKRs and how many weeks there are to go:
Each objective can be in one of four states, depending on their progress, like shown on the two graphs on the dashboard:
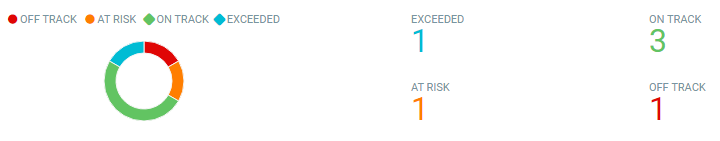
Exceeded – completion over 100% of expectation.
On track – completion 66-100% of expectation.
At risk – completion 33-66% of expectation.
Off track – completion below 33% of expectation.
The weekly graph is cut into four colored slices, each weekly dot showing where you were at that point in time versus the weekly expectation:
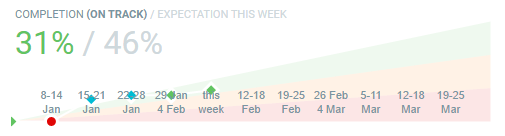
You can see in the graph label that by 6th week the expected progress is 46%. That means that to hit green, you have to be in the range of 30-46% (that’s 66-100% of 46%). The current completion is 31%, so it’s nicely in the green. Additionally, you can see that in second week the person had not made any progress, so the OKRs were red, but by 3rd and 4th week they had exceeded their expectation.
When hovering over any closed section line you’ll also see the state of each objective:

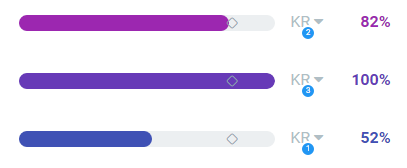
There is also a diamond marker here, showing the expected completion by that week. The same goes for the key result progress bars:
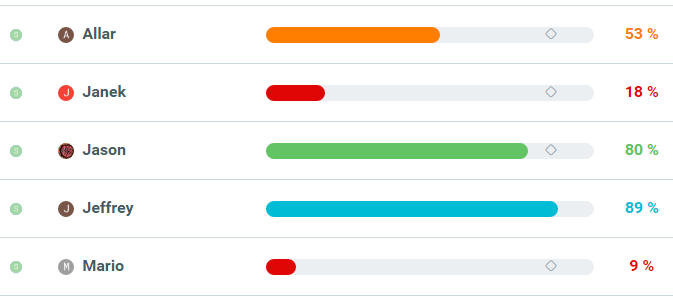
In the company and team views you’ll also be able to quickly see, by color, each person’s current state:
The new graphs and dashboards are visible in any OKR view: company, department, team, or personal. The company dashboard also shows an overview for each level’s completion towards expectations.
Now go log in to your Weekdone and see those shiny automated dashboards in action. If not a user yet, sign up for free here. At least for us, they’ve been a joy to use, driving us to check and update our OKRs more, and stay on track. Enjoy!
Have questions? See the product in action with a guided demo from our OKR experts.
More OKR materials: