Engaged teams are the engine behind moving OKRs forward and getting results week-by-week. For managers, it’s vital to keep track of the teams’ happiness as well as performance. Our latest update in Overview dashboards will help Weekdone admins and team managers with just that.
Weekly graphs
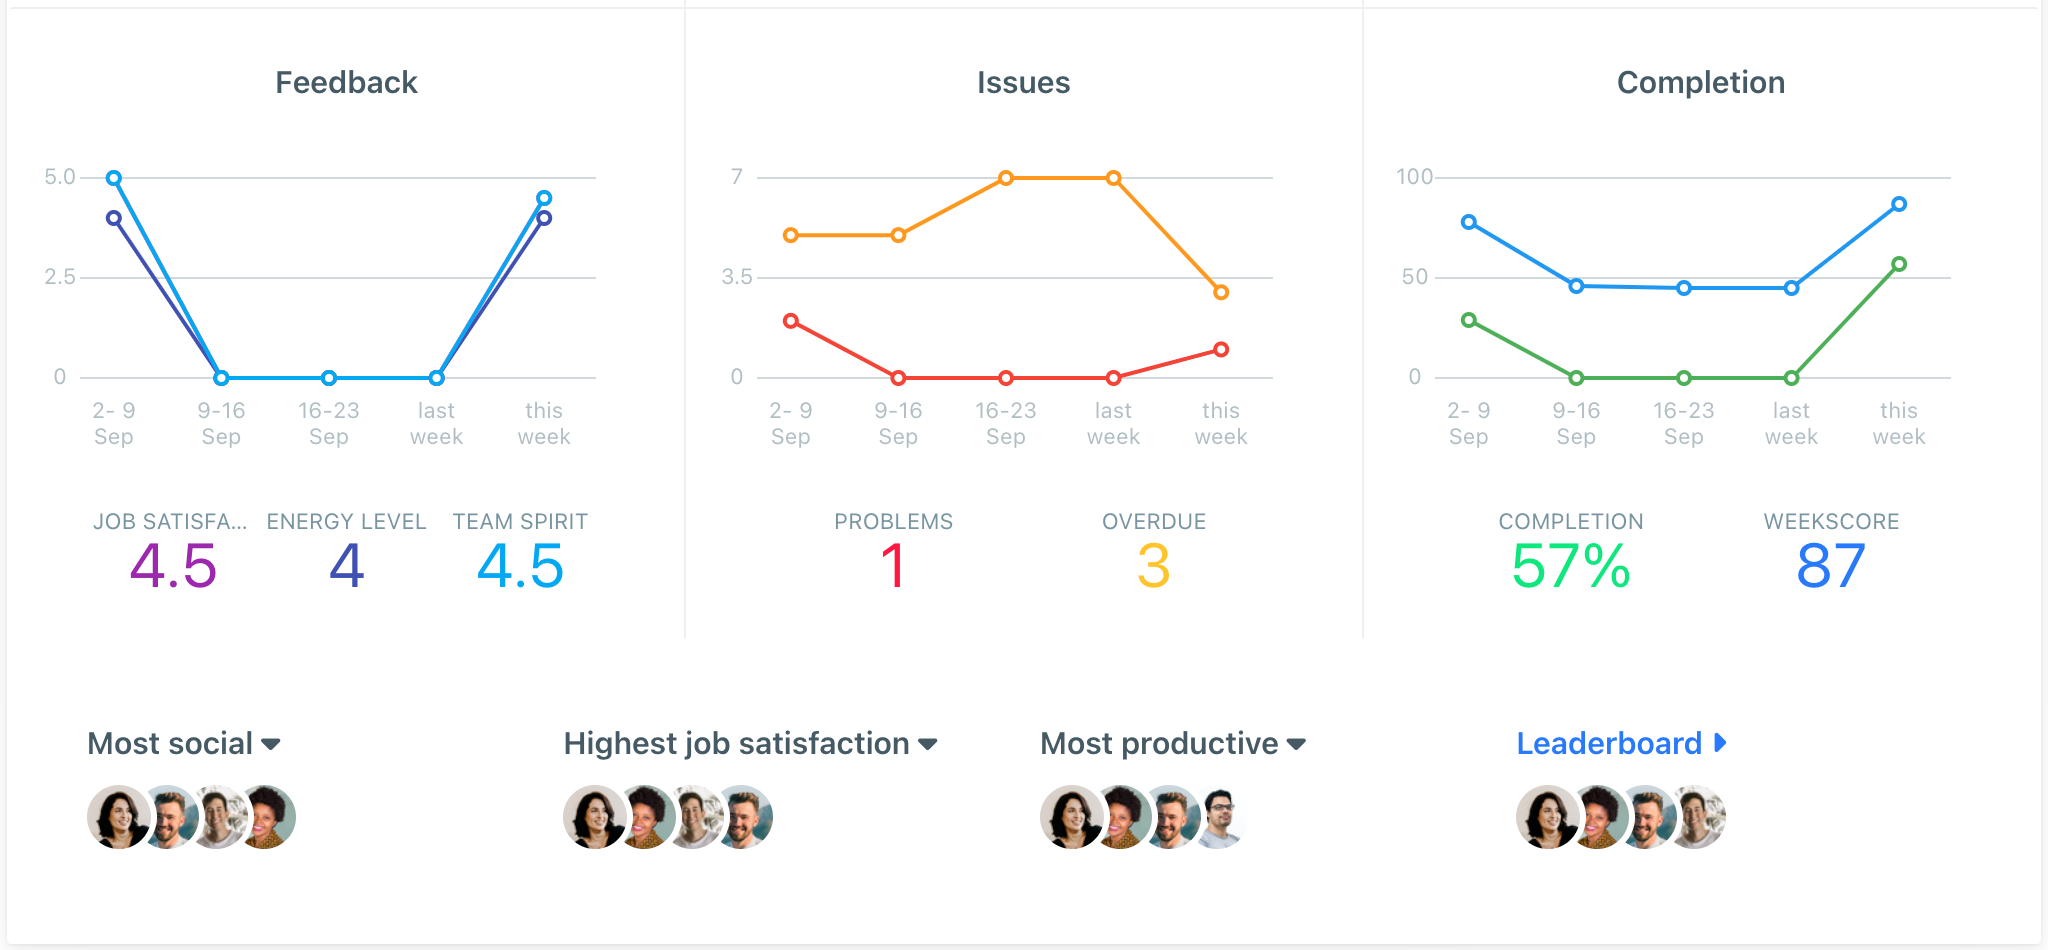
Overview dashboards now include graphs that visualize the health of your teams based on people’s weekly activity and feedback. At a glance, you’re able to review the following team stats:
- Feedback
See the average job satisfaction score given over the last five weeks. If you’ve set up other 5-star rating questions, you’ll see the numbers for these as well. Those scores give you insight to how people are feeling about their jobs – if scores are too low, you might want to check in with people to see what’s the cause and what can be improved.
- Issues
See how many weekly problems and overdue items your teams have. If too many pile up, you’ll know there’s something that needs a closer look, and the team could use some help.
- Completion
See the percentage of plans completed last week – how much people got done from their last week’s plans. Completion doesn’t take into account plans that were added and completed in the same week.
Weekscore displays a total health score. It’s calculated on a 100-point scale, which combines your team’s happiness, task completion percentage, overdue items and problematic items. Each of the four parameters can give up to 25 points. The higher the total score, the better it is. Problems and overdue plans give negative points, the rest positive.
Always try to keep your Weekscore above 80. Lower than that and something is wrong: people not completing plans, tasks being overdue, many problems, or low happiness.
Social Dashboard
Below the weekly graphs are team members featured in the Social Dashboard. Easily identify who’s been a star performer, or who is lagging behind. Social Dashboard includes categories such as:
- Most Social
This is based on your Social Awards, which you can customize in Company Settings. It takes into account regular logins to Weekdone, commenting and liking, tagging team members, and feedback received.
- Highest Job Satisfaction
The users who enter scores into the 5-star rating section each week will show up here.
- Most Productive
Also customizable in Company Settings are Weekly Planning Awards. The ‘Most Productive’ users are populated based on added weekly items and progress of plans.
- Leaderboard
The highest performing team members by engagement and productivity, based on individual Weekscore and upvotes.
Check it out
Go and see the new graphs in action:
- Click on Overview in the menubar
- Navigate to chosen level – Company, Department, or Team – from sidebar
- Click on the Objectives dashboard to open it up
- Scroll down to see the weekly graphs and Social Dashboard –summarizing stats for people under that level
This update is visible to account admins and team managers.
Use weekly planning to drive OKRs
Weekly graphs in Overview show information users add in their weekly items. To see up-to-date information, make sure your team members consistently add in their weekly Plans, Progress and Problems.
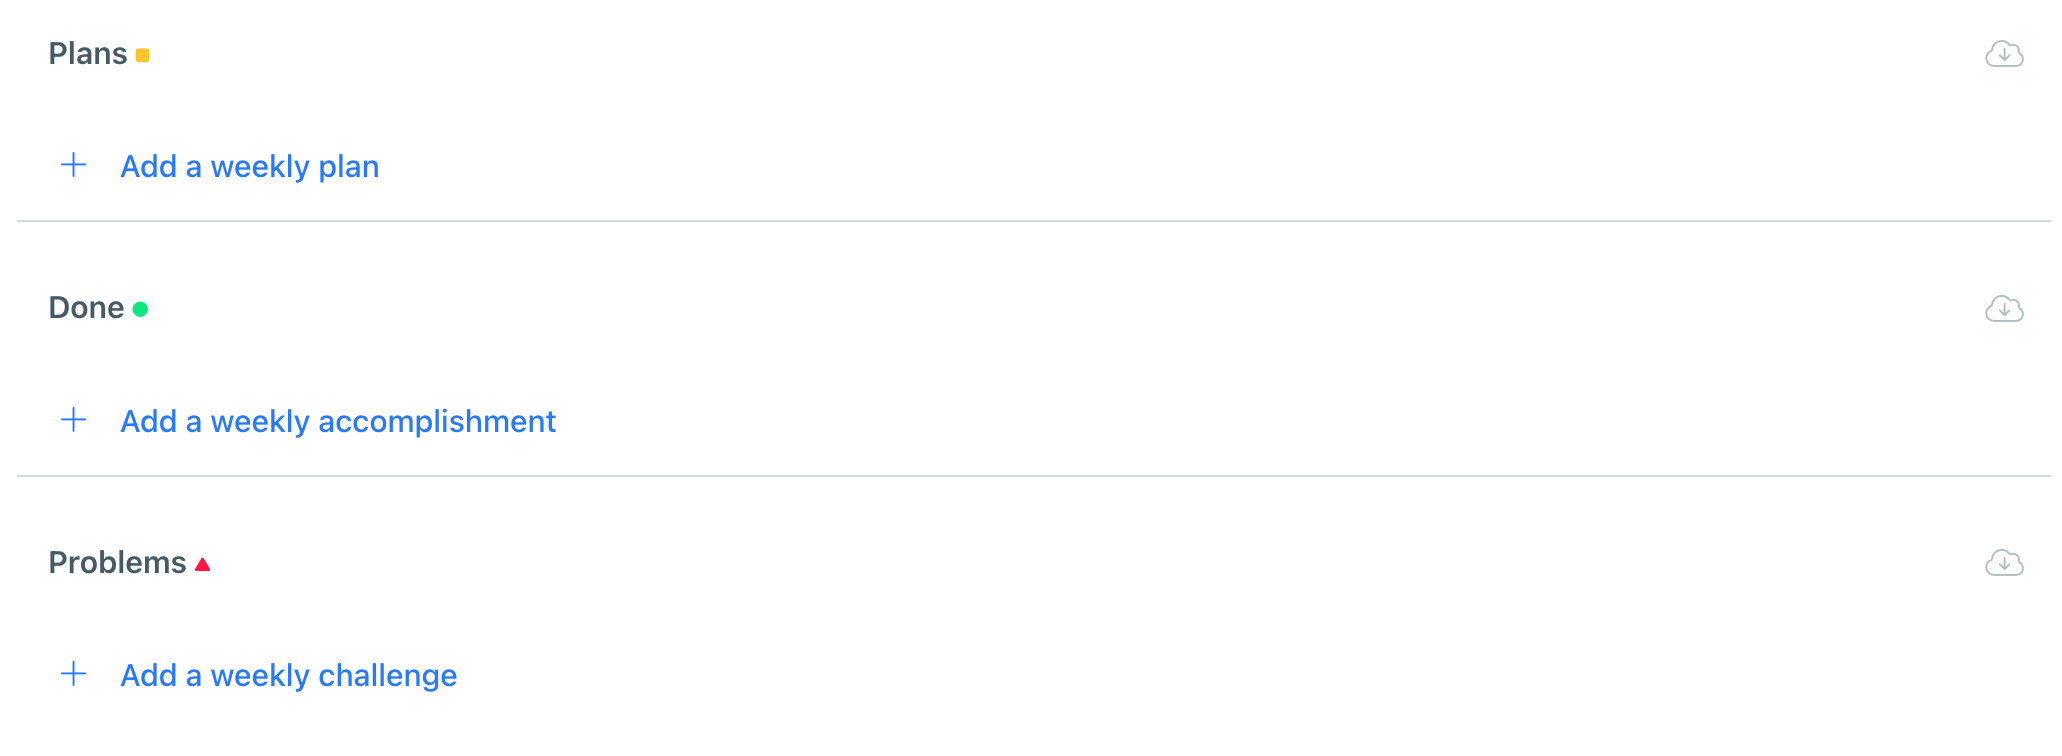
- Plans
List 3-7 most important things you want to get done this week.
- Progress or Done
Move completed weekly plans to your Progress or Done section. If you achieved something unplanned, you can also add it directly to Progress.
- Problems
List items you can’t finish or any other challenges you encountered during the week.
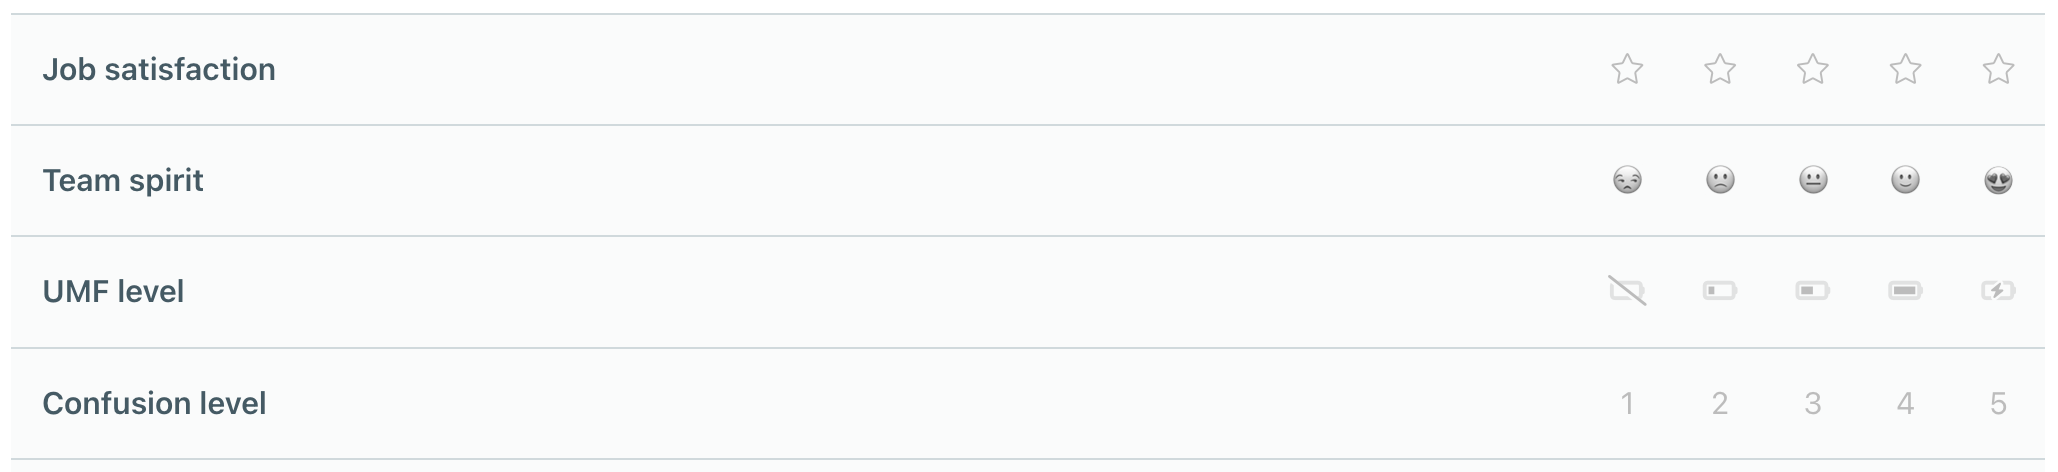
- 5-star ratings
Set up 5-star ratings to get an indication of how happy people are with their jobs on a weekly basis. You can customize the 5-star ratings to ask the questions that really matter to your company. Learn how to configure your weekly planning template here.
We hope this update helps you better understand how your teams are doing, and notice when a team needs extra attention or praise. Try it out!